Running GPU Jobs on the ORC Clusters
Available GPU Resources on Hopper
The GPU resources on Hopper currently include 31 GPU nodes each equipped with four A100 80GB GPUs and 1 node with four H100 80GB GPUs. Additionally, Hopper has 2 DGX GPU nodes, each with 8 A100.40GB GPUs and. Currently, eight of the GPU nodes in the gpuq partition are subdivided into MIG GPU slices. This further increases the number of available gpu instances that can be started on Hopper by adding a number of small logical MIG GPUs. For more information on how to determine which GPU resources are currently available see 'Finding Available GPUs'
Important: Due to high GPU demand, only MIG GPU slices are available for interactive sessions with Open OnDemand or salloc. To use A100.40GB, A100.80GB, or H100.80GB GPUs, you must submit a slurm job using sbatch.
Multi-Instance GPU partitioning
On select GPU nodes, the GPU devices are partitioned into smaller slices to optimize access and utilization. When enabled to operate in MIG (Multi-Instance GPU) mode, GPUs can be sliced into as many as 7 instances each with their own dedicated resources. This enables multiple users or applications to share a single GPU, improving overall utilization and efficiency. For the details of how MIG partitioning works see the NVIDIA documentation here.
The following table outlines three MIG partition types with varying resource allocations: MIG 1g.10gb has a 1/8 memory fraction, 1/7 fraction of Streaming Multiprocessors (SMs), no NVDEC (NVIDIA Decoder) hardware units, 1/8 L2 cache size, and 8 nodes; MIG 2g.20gb features a 2/8 memory fraction, 2/7 fraction of Streaming Multiprocessors (SMs), 1 NVDEC (NVIDIA Decoder) hardware unit, 2/8 L2 cache size, and 4 nodes; MIG 3g.40gb comes with a 4/8 memory fraction, 3/7 fraction of Streaming Multiprocessors (SMs), 2 NVDEC (NVIDIA Decoder) hardware units, 4/8 L2 cache size, and 4 nodes.
GPU Instance Profiles on A100 Profile
| Name | Fraction of Memory | Fraction of SMs | Hardware Units | L2 Cache Size | Number of Nodes | Total Available |
|---|---|---|---|---|---|---|
| MIG 1g.10gb | 1/8 | 1/7 | 0 NVDECs | 1/8 | 8 | 64 |
| MIG 2g.20gb | 2/8 | 2/7 | 1 NVDECs | 2/8 | 4 | 32 |
| MIG 3g.40gb | 4/8 | 3/7 | 2 NVDECs | 4/8 | 4 | 32 |
To make the most of the GPUs on Hopper, it is essential to evaluate your job's requirements and select the appropriate GPU slice based on availability and suitability. For instance, if your simulation demands minimal GPU memory, a MIG 1g.10gb slice (providing 10GB of GPU memory) would be more suitable, reserving larger slices for jobs with higher memory needs. In the context of machine learning, training tasks generally require more computation and memory, making a full GPU node or a larger slice like MIG 3g.40gb ideal, while inference tasks can be efficiently executed on smaller slices like MIG 1g.10gb or MIG 2g.20gb.
Our cluster currently offers 32 MIG 3g.40gb partitions, 32 MIG 2g.20gb partitions, and 64 MIG 1g.10gb partitions. This configuration ensures the most efficient use of our limited GPU resources. MIG technology enables better resource allocation and allows for more diverse workloads to be executed simultaneously, enhancing the overall performance and productivity of the cluster. The partitioning of GPU nodes is expected to evolve over time, optimizing resource utilization.
Important Caveats Concerning MIG devices
There are a number of limitations that are imposed when using a MIG instance.
- CUDA applications treat a Compute Instance and its parent GPU Instance as a single CUDA device.
- CUDA IPC across GPU instances is not supported.
- No GPU to GPU P2P (either PCIe or NVLink) is supported.
MIG supports running CUDA applications by specifying the CUDA device on which the application should be run. The current CUDA release only supports enumeration of a single MIG instance. In other words, regardless of how many MIG devices are visible, a single CUDA process can only enumerate a single MIG device.
For most applications there is therefore no purpose to requesting multiple MIG devices as any CUDA application will only use the first visible device by default. There may be cases where it is still desirable to run jobs with multiple MIG devices and we have document with instructions on running jobs with multiple MIG devices at this link.
Running GPUs jobs
GPU jobs can be run either from a shell session or from the Open OnDemand web dashboard.
GPU jobs from Open OnDemand
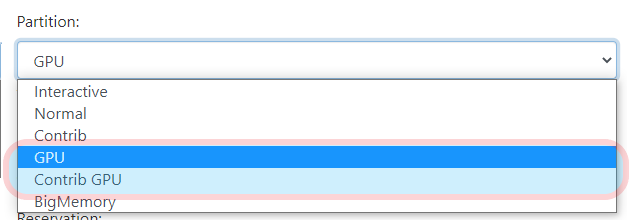
After logging into Open OnDemand, select the app you want to run on and complete the resource configuration table. To run your job on any of the available GPU resources, you need to select the 'GPU' or 'Contrib GPU' for the partition:

You also need to set the correct GPU size depending on your jobs needs:


After setting the additional options, your app will start on the selected GPU once you launch it. Note that only MIG GPU slices are available to Open OnDemand interactive sessions. To utilize A100.40GB, A100.80GB or H100.80G GPUs, your must submit a job using a Slurm submission script.
GPU Jobs with Slurm
To run on the GPUs with Slurm, you need to set the correct PARTITION, QOS and GRES option when defining your Slurm parameters.
The Partition and QOS respectively are set with: - Partition:
#SBATCH --partition=gpuq
or
#SBATCH --partition=contrib-gpuq
The contrib-gpuq partition can be used by all, but runs from accounts that are not Hopper GPU node contributors will be open to pre-emption.
- QOS:
#SBATCH --qos=gpu
You need to combine the partition and qos to run on the gpu nodes.
You also need to set the type and number of GPUs you need to use with the gres parameter. The available GPU GRES options
are show in the following table:
| Type of GPU | Slurm setting | No. of GPUs on Node | No. of CPUs | RAM |
|---|---|---|---|---|
| 1g 10GB | --gres=gpu:1g.10gb:nGPUs | 4 | 64 | 500GB |
| 2g 20GB | --gres=gpu:2g.20gb:nGPUs | 4 | 64 | 500GB |
| 3g 40GB | --gres=gpu:3g.40gb:nGPUs | 4 | 64 | 500GB |
| A100 80GB | --gres=gpu:A100.80gb:nGPUS | 4 | 64 | 500GB |
| DGX A100 40GB | --gres=gpu:A100.40gb:nGPUs | 8 | 128 | 1TB |
| H100 80GB | --gres=gpu:H100.80gb:nGPUS | 4 | 112 | 2TB |
Where nGPUs is the number of GPUs required (normally 1). Modify your Slurm options to make sure that you are requesting a suitable GPU slice.
GPU runs with Slurm can be made either interactively, directly on the gpu node or in batch mode with a Slurm script.
Working interactively on a GPU
You start an interactive session on a GPU node with the salloc command:
salloc -p gpuq -q gpu --nodes=1 --ntasks-per-node=12 --gres=gpu:1g.10gb:1 --mem=15gb -t 0-02:00:00
This command will allocate you the specified gpu resources (a 1g.10gb MIG instance) 12 cores and 15GB of memory for 2 hours on the gpu node. Once the resources become available, your prompt should now show that you're on one of the Hopper nodes.
salloc: Granted job allocation
salloc: Waiting for resource configuration
salloc: Nodes amd021 are ready for job
[user@amd021 ~]$
Once allocated, this will give you direct acces to the gpu instance where you can then work interactively from the command line. Modules you loaded while on the head nodes are exported onto the node as well. If you had not already loaded any modules, you should be able to load them now as well. To check the currently loaded modules on the node use the command shown below :
$ module avail
The interactive session will persist until you type the 'exit' command as shown below:
$ exit

exit
salloc: Relinquishing job allocation
Using a Slurm Submission Script
Once your tests are done and you're ready to run longer jobs, you should now switch to using
the batch submission with Slurm. To do this, you write a Slurm script setting the different parameters
for your job, loading the necessary modules, and executing your Python script which is then submitted to the
selected queue from where it will run your job. Below is an example Slurm script (run.slurm) for a Python job
on the GPU nodes. In the script, the partition is set to gpuq and number of GPU nodes needed is set to 1:
#!/bin/bash
#SBATCH --partition=gpuq                    # need to set 'gpuq' or 'contrib-gpuq'  partition
#SBATCH --qos=gpu                           # need to select 'gpu' QOS or other relvant QOS
#SBATCH --job-name=python-gpu
#SBATCH --output=/scratch/%u/%x-%N-%j.out   # Output file
#SBATCH --error=/scratch/%u/%x-%N-%j.err    # Error file
#SBATCH --nodes=1
#SBATCH --ntasks-per-node=1                 # number of cores needed
#SBATCH --gres=gpu:1g.10gb:1                # up to 8; only request what you need
#SBATCH --mem-per-cpu=3500M                 # memory per CORE; total memory is 1 TB (1,000,000 MB)
#SBATCH --export=ALL
#SBATCH --time=0-02:00:00                   # set to 2hr; please choose carefully

set echo
umask 0027

# to see ID and state of GPUs assigned
nvidia-smi

module load gnu10
module load python

python myscript.py
Preferably, use the scratch space to submit your job's Slurm script with
sbatch run.slurm
cd /scratch/UserID command to change directories(replace 'UserId' with your GMU GMUnetID). Please note that scratch directories have no space limit and data in /scratch gets purged 90 days from the date of creation, so make sure to move your files to a safe place before the purge.
To copy files directly from home or scratch to your projects or other space you can use the cp command to create a copy of the contents of the file or directory specified by the SourceFile or SourceDirectory parameters into the file or directory specified by the TargetFile or TargetDirectory parameters. The cp command also copies entire directories into other directories if you specify the -r or -R flags.
The command below copies entire files from the scratch space to your project space (" /projects/orctest" as shown in the example below, where " /projects/orctest" is a project space)
[UserId@hopper2 ~]$ cd /scratch/UserId
[UserId@hopper2 UserId]$ cp -p -r *  /projects/orctest
Finding Available GPUs
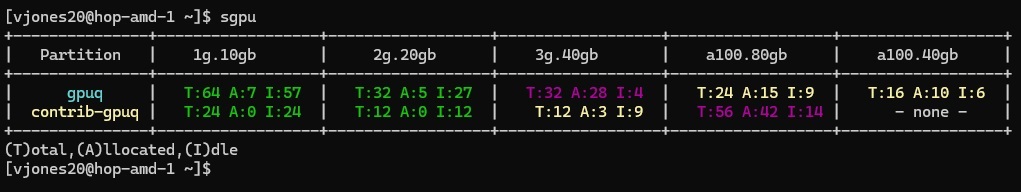
Hopper includes the 'sgpu' utility, which is used to analyze current cluster GPU usage and highlight free GPU resources. sgpu is part of the slurm-tools/2023-09 module and is loaded by default. To use sgpu, login to a node and run the command 'sgpu'. This will output an overview of nodes in the gpuq and contrib-gpuq partitions. GPU availability is color coded, green indicates that more than 75% of total GPUs are available. Yellow indicates that between 75%-25% of the GPUs are available. Magenta indictates that fewer than 25% of the GPU type is availabe. And red indicates that all of that type of GPU are currently allocated.
In the following example image, there are 81 total available 1g.10gb GPUs and 39 total available 2g.20gb GPUs across both GPU partitions. This example also shows that there are only four idle 3g.40gb GPUs and nine available a100.80 GPUs in the gpuq partition. However there are nine 3g.40gb GPUs and fourteen a100.80gb GPUs in the contrib-gpu partition. When there are few available GPUs in the gpuq partition, it may be useful to allocate GPUs in the contrib-gpu partition. Note, that running on contrib-gpu using the default gpuq qos will open your job up to pre-emption. So it is reccommended that shorter jobs, or jobs which can be restarted take advantage of these resources.
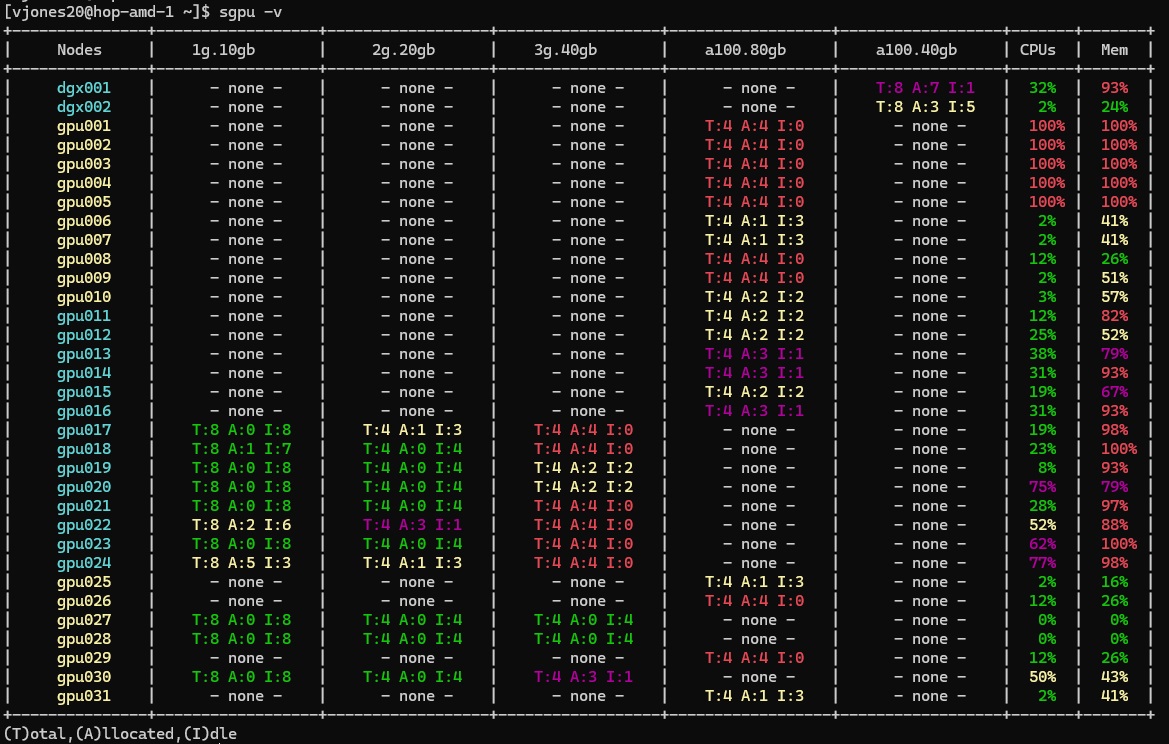
It is often useful to perform a more detailed analysis of gpu nodes. This can be obtained by running sgpu with the -v parameter. 'sgpu -v' outputs the following information with the same color coding for GPU availability. Note that nodes use a separate color coding, with gpuq nodes highlighted in cyan and contrib-gpuq nodes highighted in yellow. Of note, the verbose output for sgpu also shows CPU and memory allocation for GPU nodes. In the event that all of a node's CPUs or memory is allocated, it may be impossible to run jobs on that node, even if the node has free GPUs. This is why it is important that users do not allocate more system memory than necessary.
Measuring GPU Utilization in Real Time
To see how effectively your job is using the GPU, first find the node where the job is running:
$ squeue -u $USER
$ ssh gpu[XXX]
In the command above, you must replace XXX with the appropriate values (e.g., ssh gpu022). Once on the compute node, run watch -n 1 nvidia-smi. This will show you a percentage value indicating how effectively your code is using the GPU. The temperature and amount of GPU memory being used are also available (e.g., 1813 / 16280 MB). You could also use nvtop, nvitop or gpustat. Press Ctrl+C to exit from watch. Use the exit command to leave the compute node and return to the head node. For indepth details please navigate to monioring jobs page.
Note that GPU utilization as measured using nvidia-smi is only a measure of the fraction of the time that a GPU kernel is running on the GPU. It says nothing about how many CUDA cores are being used or how efficiently the GPU kernels have been written. However, for codes used by large communities, one can generally associate GPU utilization with overall GPU efficiency. For a more accurate measure of GPU utilization, use Nsight Systems or Nsight Compute to measure the occupancy (see the "Profiling" section below).
Profiling
The starting point for profiling a Python code that uses a GPU (this includes PyTorch and TensorFlow) is to use line_profiler
NVIDIA provides Nsight Systems for profiling GPU codes. It produces a timeline and can handle MPI but produces a different set of profiling data for each MPI process.
To look closely at the behavior of specific GPU kernels, NVIDIA provides Nsight Compute
Load an appropriate cuda toolkit module (preferrably the latest version).
[ ~]$ ml cuda/12.3.1
[ ~]$ ncu --version
NVIDIA (R) Nsight Compute Command Line Profiler
Copyright (c) 2018-2023 NVIDIA Corporation
Version 2023.3.1.0 (build 33474944) (public-release)
[ ~]$ nsys --version
NVIDIA Nsight Systems version 2023.3.3.42-233333266658v0
The corresponding GUIs for these tools (ncu-ui, and nsys-ui) requires a remote display. You may use a "Desktop" session via Open Ondemand. Or download the file to your local machine. To start a graphical desktop, choose the "Desktop" GUI app and select a GPU enabled partition either contrib-gpuq or gpuq and a small gpu device. Once the session starts, click on the black terminal icon at the bottom and then run either "nsys-ui" or "ncu-ui".
Introductory videos about Nsight can be found here and here
How to Improve Your GPU Utilization
Recall that there are typically three main steps to executing a function on a GPU in a scientific code: (1) copy the input data from the CPU memory to the GPU memory, (2) load and execute the GPU kernel on the GPU and (3) copy the results from the GPU memory to CPU memory. Effective GPU utilization requires minimizing data transfer between the CPU and GPU while at the same time maintaining a sufficiently high transfer rate to keep the GPU busy with intensive computations. The algorithm running on the GPU must also be amenable to the GPU.
When the GPU is underutilized the reason is often that data is not being sent to it fast enough. In some cases this is due to hardware limitations such as slow interconnects while in others it is due to poorly written CPU code or users not taking advantage of the data loading/transfer functionality of their software.
If you are experiencing poor GPU utilization then try writing to the mailing list for your code and asking for ways to improve performance. In some cases just making a single change in your input file can lead to excellent performance. If you are running a deep learning code such as PyTorch or TensorFlow then try using the specialized classes and functions for loading data (PyTorch or TensorFlow). One can also try varying the batch size if this does not affect the overall performance of the model (e.g., accuracy or RMSE). These two changes can be sufficient to increase the data transfer rate and keep the GPU busy. Keep in mind that an NVIDIA A100 GPU has either 40 or 80 GB memory. If you exceed this value then you will encounter a CUDA out of memory error which will cause the code to crash.
If you are unable to find a way to reach an acceptable level of GPU utilization then please run your jobs on CPU nodes.
Zero GPU Utilization
Below are three common reasons why a user may encounter 0% GPU utilization:
- Is your code GPU-enabled? Only codes that have been explicitly written to use GPUs can take advantage of them. Please consult the documentation for your software. If your code is not GPU-enabled then please remove the --gres Slurm directive when use a non-gpu partition such as "normal" or "bigmem" when submitting jobs.
- Make sure your software environment is properly configured. In some cases certain libraries must be available for your code to run on GPUs. The solution can be to load an environment module or to install a specific software dependency. If your code uses CUDA then CUDA Toolkit 12 or higher should be used on Hopper. Please check your software environment against the installation directions for your code.
- Please do not create salloc sessions for long periods of time. For example, allocating a GPU for 24 hours is wasteful unless you plan to work intensively during the entire period. For interactive work, please consider using the MIG GPUs.
Low GPU Utilization: Potential Solutions
If you encounter low GPU utilization (e.g., less than 15%) then please investigate the reasons for the low utilization. Common reasons include:
- Misconfigured application scripts. Be sure to read the documentation of the software to make sure that you are using it properly. This includes creating the appropriate software environment.
- Using an A100 GPU when a MIG GPU would be sufficient. Some codes do not have enough work to keep an A100 GPU busy. If you encounter this on the Hopper cluster then consider using a MIG GPU.
- Training deep learning models while only using a single CPU-core. Codes such as PyTorch and TensorFlow show performance benefits when multiple CPU-cores are used for the data loading.
- Using too many GPUs for a job. You can find the optimal number of GPUs and CPU-cores by performing a scaling analysis.
- Writing job output to the /groups, /projects or /home storage systems. Actively running jobs should be writing output files to /scratch.
Common Mistakes
The most common mistake is running a CPU-only code on a GPU node. Only codes that have been explicitly written to run on a GPU can take advantage of a GPU. Read the documentation for the code that you are using to see if it can use a GPU.
Another common mistake is to run a code that is written to work for a single GPU on multiple GPUs. TensorFlow, for example, will only take advantage of more than one GPU if your script is explicitly written to do so. Note that in all cases, whether your code actually used the GPU or not. It is very important to make sure that you only request GPUs when you can efficiently utilize them.
How to Improve Your GPU Knowledge and Skills
Check out this comprehensive resources list.